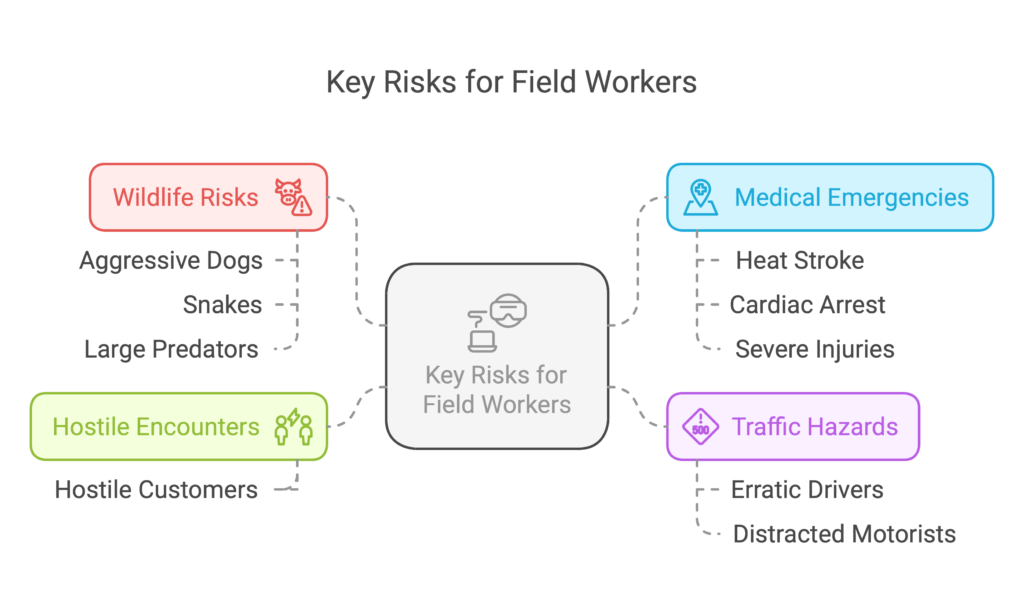
In 1969, Frank Bird studied 1,753,498 industrial accidents and found that for every serious injury, there were 10 minor injuries, 30 property-damage events, and 600 near misses. The 1:10:30:600 ratio is imperfect and modern safety researchers have moved past it toward Serious Injury and Fatality (SIF) potential. But the underlying point still holds: the events your incident log captures sit on top of a much larger base of events your incident log does not.
Your Total Recordable Incident Rate is probably the best it has ever been. Your OSHA 300 log is clean. And somewhere in your service territory right now, a worker is in a situation none of that data captures.
That is the gap. Utility worker safety visibility is not about the metrics on the slide deck. It is about whether you can see what is happening underneath them while it is happening, not after the fact.
Why a Clean OSHA Log Can Mask a Bigger Problem
Workers under-report near misses. The peer-reviewed safety literature is consistent on this point. They under-report because reporting slows the job down, because the culture treats it as paperwork, or because the mechanism to report is awkward enough that workers default to silence. The result is that the bottom of your safety pyramid is shallower than the actual field risk supports.
That matters for two reasons. First, lagging metrics like TRIR, DART, and OSHA recordables only count the events that surfaced. They cannot count the events that did not. Second, when leadership asks whether the safety program is working, the honest answer for most utilities is that you do not actually know. You know nothing was reported yesterday. That is a smaller statement than it sounds.
You know nothing was reported yesterday. That is a smaller statement than it sounds.
The utility industry has made real safety progress over two decades. But low recordable rates can hide deteriorating field conditions. Electrical Safety Foundation International data shows the utility sector still had the highest rate of workplace electrical fatalities of any U.S. industry between 2011 and 2024. A trend line and a moment in the field are different things.
The Three Questions Your Lagging Metrics Cannot Answer
Strip the compliance framing away and what a safety leader actually needs to know comes down to three questions:
- Are my workers in situations right now that could hurt them?
- When something dangerous happens, how quickly does someone in the chain know?
- Are there patterns in our field risk we have not identified yet?
Lagging indicator data does not answer any of those questions. They require something closer to real-time field visibility, not a quarterly TRIR review. They require data that is current to this morning, not last quarter.
Where Field Visibility Disappears Between the Tailgate and the Tie-In
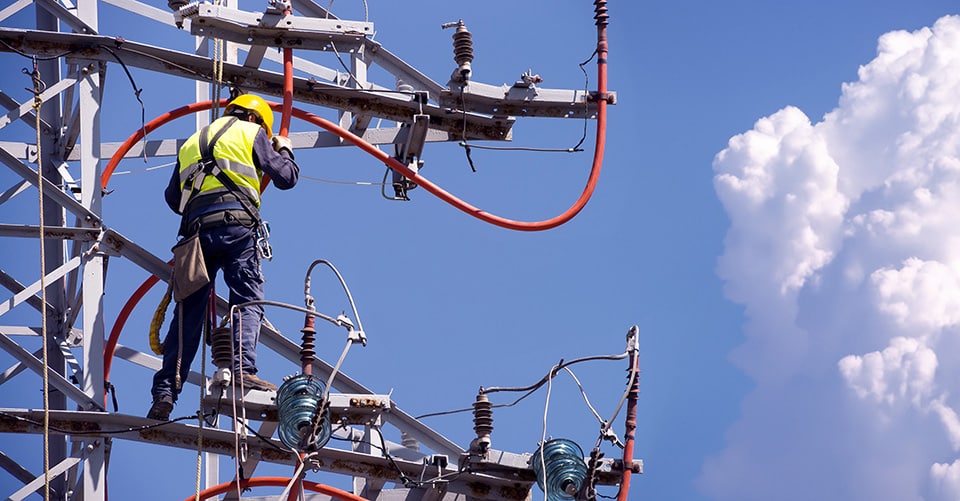
A supervisor managing eight workers across a substation, a right-of-way corridor, and a transmission line segment cannot physically be in all three places. Manual check-ins create an illusion of contact. Radio is intermittent. Paper safety observations capture a sample of one moment, not a pattern.
In practice, a field supervisor's sense of crew status is built on professional judgment, past experience, and the absence of bad news. When something goes wrong in a location the supervisor cannot see, the first indication is usually the incident itself.
This is not a failure of the supervisor. It is a structural problem in how field safety visibility has historically been possible to achieve. Until recently, the only tools available were periodic check-ins and post-incident review. Neither of those is real-time.
What Leading Indicators in Utility Field Safety Actually Look Like
Safety professionals know the difference between lagging and leading indicators. The harder question is which leading indicators actually predict serious incidents in the field, and whether you can collect them without being physically present.
The honest leading indicators for utility field work include hazard proximity events, impact and fall events in high-risk locations, SOS activation frequency by zone, and how quickly supervisors respond to fired alerts. None of those exist in your OSHA log. Most of them do not exist in your traditional safety management software either. For most organizations, this data is not being collected at all.
Connected safety platforms collect it. Compass Pro™ devices generate event records for every voltage and current alert, every detected impact, fall, and arc flash event, every SOS activation. The Navigator® platform aggregates those events into patterns: by worker, by zone, by hour of day, by season. That is the missing data layer. It does not replace TRIR. It explains what is sitting underneath it.
What Real-Time Field Safety Data Should Surface
A connected safety platform built for utility field operations should answer the practical questions a supervisor or safety leader has on any given day:
- Which workers are in the field right now, and where?
- Have any hazard detection alerts fired today, and were they acknowledged?
- Are there any impact or fall events, or workers whose devices have dropped offline, that need follow-up?
- What does alert history over the past 90 days show about risk patterns in specific work zones?
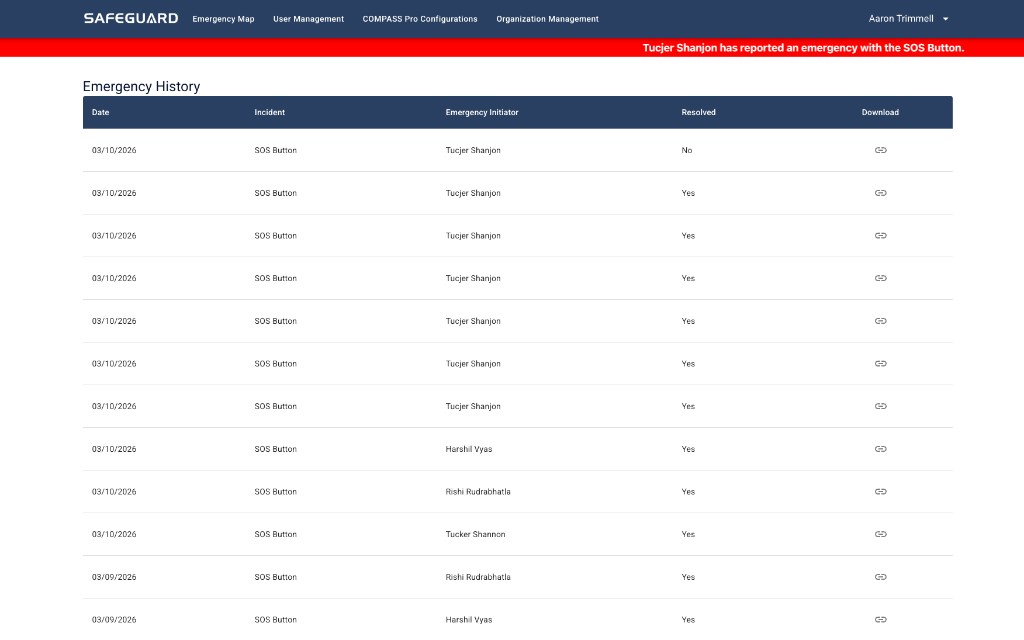
The Navigator platform answers exactly those questions. Real-time worker location, alert management, SOS workflows, and historical analytics give safety leaders the field visibility traditional programs have never provided. The deeper view of how to turn that data into operating decisions sits in utility safety analytics.
What It Costs to Run a Safety Program in the Dark
There is a direct organizational cost to operating without this visibility, and it goes beyond the risk of the next incident. Safety leaders who cannot demonstrate real-time program effectiveness are in a structurally weak position when safety investment decisions come up. 'We have not had a recordable this year' is not a defensible argument in a 2026 budget review. 'Here is what our field crews encountered this quarter, how our system responded, and what we changed as a result' is.
Those benchmarks reflect what shifts when a safety program is operating on current data instead of last quarter's outcome metrics.
If you cannot see what is happening in the field, you cannot prevent the next incident.
The cost of remaining in the dark is not abstract. It is the gap between what your metrics say and what your workers are walking into right now.
What Safety Leaders Ask When They Start Evaluating Field Visibility
Those leading indicators measure safety program activity, not field conditions. They tell you what your organization is doing. They do not tell you what your workers are encountering. Both matter. Connected safety data adds the second category, which has historically been impossible to collect without being on site.
Navigator is built to convert event history into trends: by worker, by zone, by alert type, over time. Emergency history logs are exportable for safety committee and board reporting. Leadership does not see the underlying noise. They see the pattern, and the record behind it when they ask for it.
The strongest deployments frame the device as a worker protection tool, not a monitoring tool. The Compass Pro alerts the worker first. Supervisor visibility is a second-layer benefit. Crews running the system consistently report it builds confidence rather than friction, because the alerts confirm when a zone is clear and flag when it is not.
Yes. The Navigator platform scales by user, and Compass Core™ or Compass Pro can be rolled out to crews of any size. Smaller operations often see faster adoption because the chain of supervision is shorter and the data loop closes quickly. Ask your Safeguard representative about staged deployment for organizations under 100 workers.